
In online retail, it is possible to track almost everything: from your Facebook page likes to lifetime value of every customer, but it takes much time and efforts to get the data and focus on the metrics that matter for your online store growth.
Let’s dive into the world of data and decide what metrics are vital for our store and what metrics should be considered vanity metrics.
An online store has one main reason to exist – it is to gain more money. More customers equal higher conversions and higher revenue, lower logistics cost and employees’ salary equal fewer expenses.
Everything an online store does is aimed at a higher profit. Even an Instagram account created a week ago. Some marketers claim there is more to it: effective feedback management, building loyalty in your customer community, helping people stay tuned with latest tech changes through the company blog and so on. However nice being popular is, ultimately, no. If everybody likes you, but nobody buys anything, it means there is something wrong with your “friendly communication.”
Vanity Metrics to Never Spend Your Time on
A big group of metrics that are easily manipulated and do not necessarily correlate to the metrics that matter. Their distinctive feature is an illusion of success seasoned with big growth numbers. In reality, they are not worth a dime. It’s the illusion, Neo.

Analyzing those is a pure waste of time:
Size
Those include numbers like “1000 employees in the company”, “20K subscribers on Twitter”, “1.5 million unique email addresses in the database”, “5000 unique visits daily”. Take it with a grain of salt: “5000 visits” does not equal 5000 active customers, 20K subscribers do not mean 20K clients. You got the logic.
If you track fishy metrics that make you feel big but do not say a word about your efficiency, take a heap of those and throw them in the fire – now they can warm you.
Average session duration
Time on page, session duration and so on. People forget that ultimately the store needs to serve the customer as fast as possible. This is what all those personalized product recommendations, advanced filtering, intelligent search and other frills, inaccessible to the biggest offline stores, are for.
Naturally, if the visitor has been hanging out on your website for 30 minutes, it does not directly point everything is alright, and the quality of your store is so stellar. On the contrary, it means that the visitors are failing to find what they want.
Session length is critical for content-oriented projects, for example, a blog or a movie streaming service. In this situation, more time spent on the site equals more profit. This is not the case of an online store, however.
Metrics of “love and adorability”
The number of likes, shares and Thank You emails your store received over time may be heartwarming. Also, good for the team spirit. However, it has no obvious value and cannot influence revenue.
In the long run, 100 commentaries to your blog post may gain you, new customers. However, you’ll never know what percent of your paying audience has been acquired through them. Rather than scrupulously analyzing this data, just enjoy your popularity and redirect your attention to the following.
Provisionals: Point to Start Paying Attention
Vanity metrics is behind us – who want to waste time on measuring and optimizing the numbers with no real revenue growth?
There is another big group with things having no direct correlation in income but nevertheless playing a significant role in decision making. Let’s call them provisionals.
Those include:
- Open rate of marketing emails
- CTR (click-through-rate) of display ads
- CTR of Facebook remarketing campaigns
- Total number of orders in a particular period
Every provisional doesn’t per se inform you how effective the effort was regarding raising sales. Nevertheless, they can tell you if this or that campaign was effective in terms of traffic.
We will not list all the provisionals here as they are easily found in every marketing suite, for example, REES46 can track not only provisionals but also critical key metrics (found lower in the article).
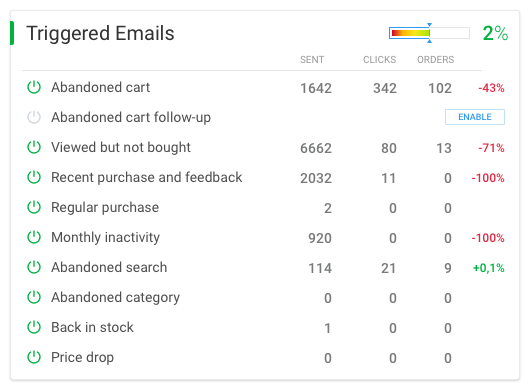
Triggered emails widget displays the number of triggered emails sent and next to it – the number of clicks made through the email. This way you know how often the customers click links in your emails. If the click rate is too low, it’s a good time to work on your call-to-action copy, or buttons layout or rework the design of your template.
Through the click on any scenario (pun intended), you get a detailed report. In it, you can see all the metrics and the dynamics:
| Type | Name | This month | Last month | All time |
| Provisional | Emails sent | 67 | 317 | 830 |
| Provisional | Emails opened | 1
1.49% |
32
10.09% |
182
21.93% |
| Provisional | Emails with clicks through | 1
100.00% 1.49% |
10
31.25% 3.15% |
34
18.68% 4.10% |
| Provisional | Unsubscribed or rejected | 0
0.00% |
0
0.00% |
1
0.12% |
| Key | Emails with purchases | 0 | 3
Revenue: 261€ 30.00% 0.95% |
16
Revenue: 790€ 47.06% 1.93% |
Have you noticed the key metric? It is the most important one. All the provisionals are leading you to it. And every rate tells you what can be improved in your business plan.
Key Metrics
As we said before, provisional metrics are necessary to find breaches in your marketing (and your site). However, only the key metrics allow you to see the whole picture.
They are not as numerous as the provisionals, so it makes sense to allocate a paragraph to each. They are interconnected, and one is typically the base for another in the calculations and analysis.
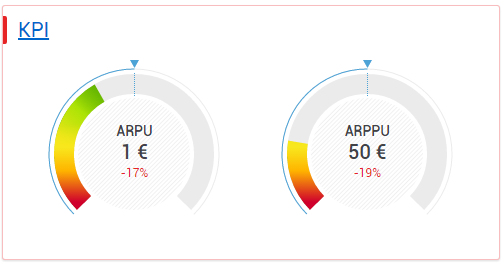
ARPU (Average Revenue Per User) and ARPPU (Average Revenue Per Paying User)
ARPU helps understand the input of every new customer into your growth. The next step is to plan your revenue growth and calculate how many new clients you need to attract in a particular period.
ARPPU helps examine the quality of paying customers. To increase ARPPU, you need remarketing, loyalty programs, personalized marketing emails – any tools that help incite your existing audience to shop more.
These two are the milestones of marketing in eCommerce. In REES46, their dynamics is presented visually in a widget:
Daily Number of Orders
REES46 calculates these figures – both for regular and recommended orders.
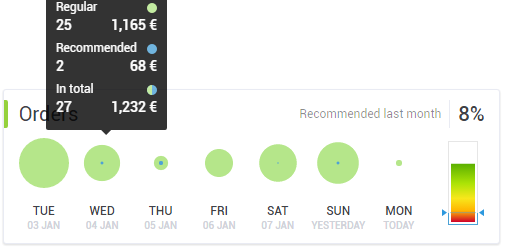
If the numbers are decreasing or flat for a long time, you can change the situation via:
- Increasing number of total daily orders. For example, buying additional traffic.
- Increasing AOV (average order value) through enabling personalized product recommendations.
- Motivating additional options. For example, offer free delivery or a gift for big orders.
AOV (Average Order Value)
Divide total revenue by the number of orders to calculate your store’s Average Order Value (AOV).
Every store is interested in selling high-margin products. If you’re not succeeding at it yet and making most sales through low-margin products, it’s a good time to entice your customers into shopping via personalized product recommendations.
Product recommendations are proven to raise AOV.
Cart Abandonment Rate
We already mentioned remarketing – one of the main ways to cure the pain of modern eCommerce. The pain that everybody knows as “Abandoned Shopping Cart.”
It’s essential to track the performance of display ads, clicks and recovered and completed purchases in relation to the number of abandoned carts.
Remarketing Funnel on unified REES46 Dashboard
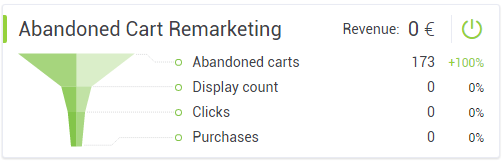
Through the click on the name, you get to the metrics and dynamics:
| Time period | Abandoned carts | Displays | Clicks |
| Current month | 173 | 0 | 0 |
| Previous month | 517 | 200 | 18 |
Conclusion
We went through three primary metrics types: vanity, provisional and key metrics.
The first category is applicable only if you want to flatter yourself.
The second category, provisionals, is necessary to find the breach in your marketing funnel and patch it up. For instance, if your marketing emails have good display rate but very low click-through rate. It probably means that you are outdone yourself with the subject line and the header, as well as your timing, but the design of your emails needs a lot more work.
The third type is the most important one. Key metrics help you find the direct correlation between your marketing efforts and your revenue. Maximize your effort on these rates to see steady growth.
Nobody, of course, can monitor all the key metrics at once. Even if you succeed in solving this problem, you’ll very probably fail at the optimization.
This is why it is so important to:
- Automate everything that can be automated. For instance, REES46 helps online businesses automate email marketing, web push campaigns, cross-sell and upsell, Facebook remarketing, remarketing through display ads, solving the cart abandonment. You can agree routine takes up much precious time.
- Avoid scattering your marketing tools around various services. The more tools you have, the more time you spend searching for new services, final integration, training, and analysis. We made it possible for you to take care of everything from a unified interface. With REES46 you can plan, launch, analyze and change campaigns on the go. Work with five, ten or more marketing tools simultaneously safely staying within one tab.
The things you just don’t think of. Many thanks.